Displaying current electricity tariff in Grafana
This is a nice and quick way to add a panel to a Grafana dashboard that shows a simple traffic light and name of the current tariff, based on day and time.
Setup
In order to add JavaScript to a Text panel, you will need to modify a Grafana setting.
In Docker, simply add environment variable GF_PANELS_DISABLE_SANITIZE_HTML with value true.
Not running in Docker? Simply update your grafana.ini config file with the above.
When you have set the above, restart Grafana.
The code
Now you can pop into Grafana and add a new Panel to your dashboard. Set the panel type to Text,
change the Mode to HTML, and use the below code. Update as you see fit.
In this example, I’m doing a basic check on what day of the week it is, and then depending on the current hour, displaying a green/yellow/red traffic light and corresponding tariff.
There is a small bit of style formatting to center it nicely in the panel, and also a JS setInterval which has the script rerun every 30 seconds - this is because the JS is not
reloaded when the dashboard refreshes - only on full page refresh.
<!DOCTYPE html>
<html>

<head>
    <style>
        .center {
            display: flex;
            justify-content: center;
            align-items: center;
            padding: 10px 0;
        }
    </style>
</head>

<body>
    <div class="center">
        <h3 id="tariff">Unknown 😥</h3>
    </div>
    <script>
        // Initial population of tariff before function interval kicks in
        get_tariff()

        // Rerun our function every 30 seconds
        setInterval(function () {
            get_tariff()
        }, 30000)

        // Our function
        function get_tariff() {
            // Current day and hour
            day = new Date().getDay()
            hour = new Date().getHours()

            // Monday to Friday
            if (day >= 1 && day <= 5) {
                if (hour < 7) {
                    document.getElementById("tariff").innerHTML = "🟢 Night";
                }
                else if (hour >= 7 && hour < 11) {
                    document.getElementById("tariff").innerHTML = "🔴 Peak";
                }
                else if (hour >= 11 && hour < 17) {
                    document.getElementById("tariff").innerHTML = "🟠 Off Peak";
                }
                else if (hour >= 17 && hour < 21) {
                    document.getElementById("tariff").innerHTML = "🔴 Peak";
                }
                else if (hour >= 21 && hour < 23) {
                    document.getElementById("tariff").innerHTML = "🟠 Off Peak";
                }
                else if (hour >= 23) {
                    document.getElementById("tariff").innerHTML = "🟢 Night";
                }
            }

            // Saturday and Sunday
            if (day == 6 || day == 0) {
                if (hour < 7) {
                    document.getElementById("tariff").innerHTML = "🟢 Night";
                }
                else if (hour >= 7 && hour < 23) {
                    document.getElementById("tariff").innerHTML = "🟠 Off Peak";
                }
                else if (hour >= 23) {
                    document.getElementById("tariff").innerHTML = "🟢 Night";
                }
            }
        }


    </script>
</body>

</html>
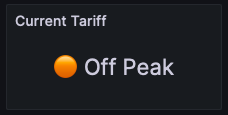
End result
This is how the dashboard panel looks, at 21:42 on a Saturday 😀