Solar Monitoring - Part 1 - Introduction
This is part 1 of a series of posts I’m writing on how I’m monitoring my solar energy production and consumption at my home in Marlborough, New Zealand.
Introduction
In March 2022, we decided to make the most of the Marlborough sun and have a PV system installed at our home.
The system consists of:
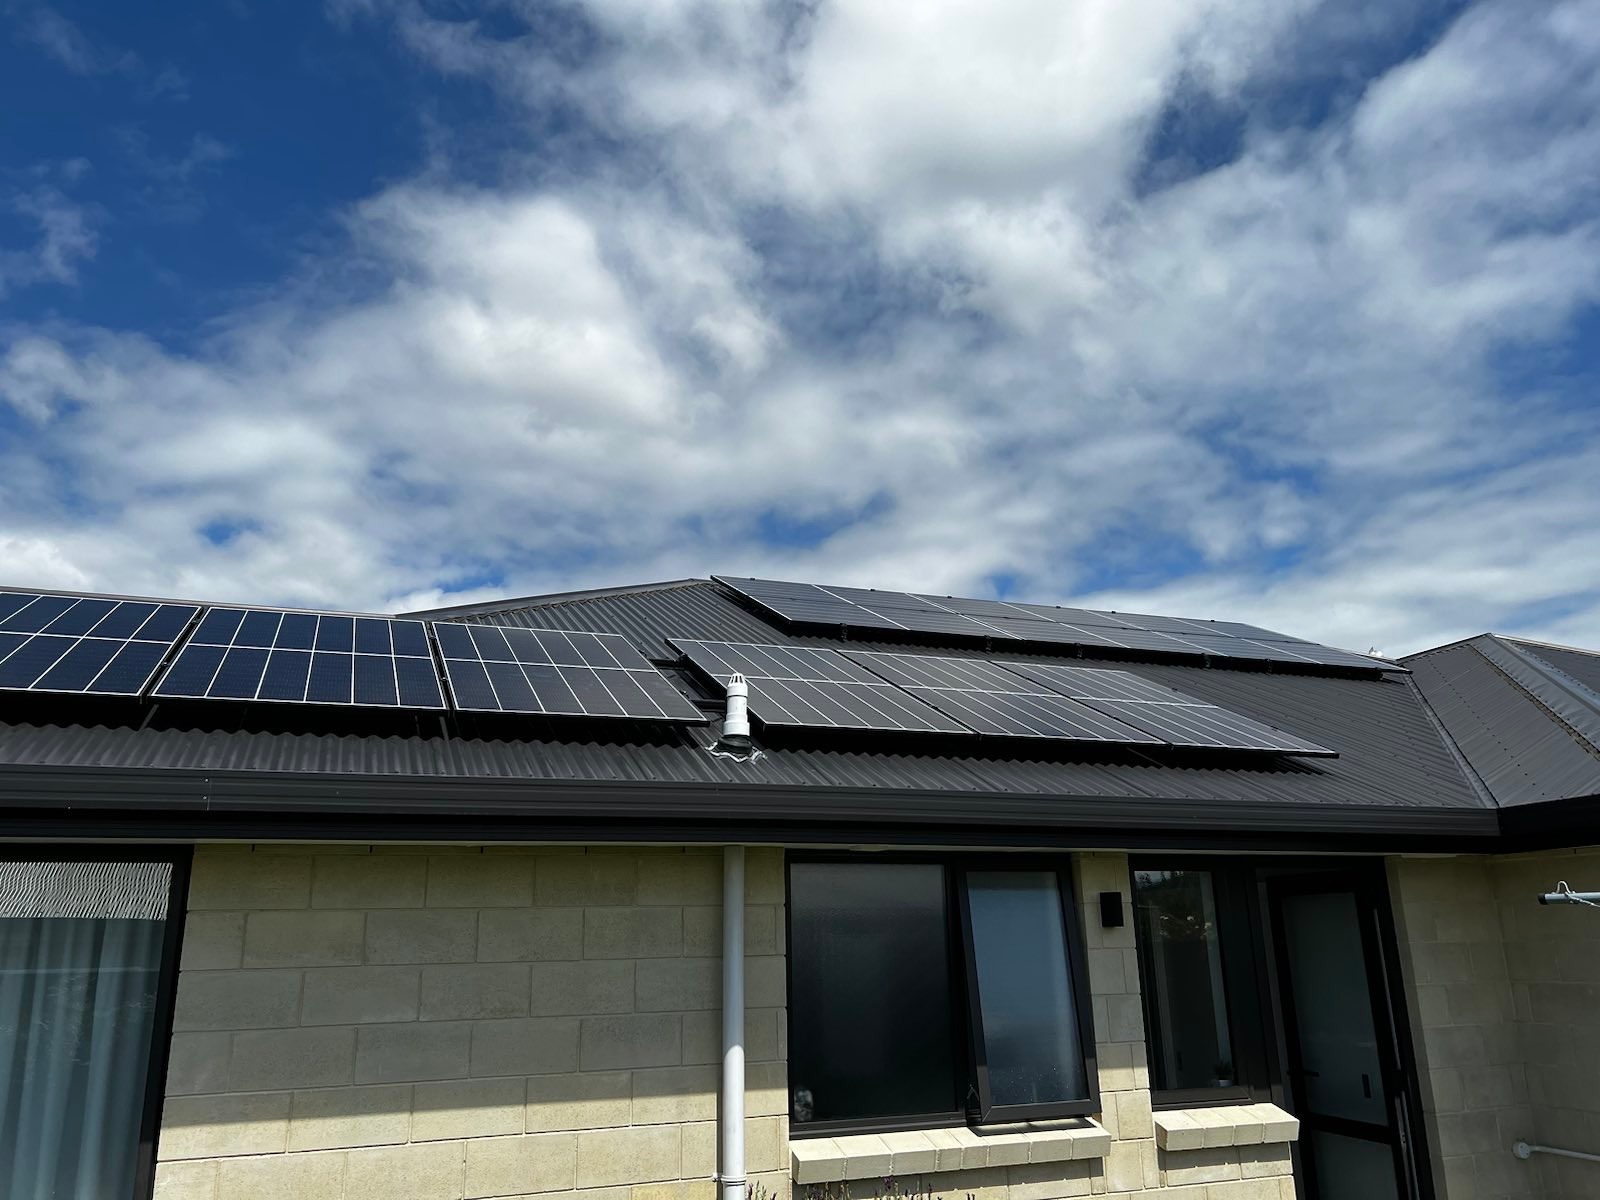
- 14 * 390W Q Cells Q.Boost PV panels, which can generate a total of 5.46kW in ideal conditions
- A Fronius Primo 6.0kW string inverter
- A Fronius Smart Meter
The PV panels are split into two strings - the first containing 8 panels, and the second having the remaining 6. All panels are installed on a single roof face, and are North facing (Southern Hemisphere 😉).
The system was commissioned on the 9th March 2022, and (at the time of writing) has generated 8.49MWh.
I’m currently monitoring the production and consumption by using Telegraf to extract the data from the JSON API of the Fronius Inverter (which communicates with the Fronius Smart Meter) every 10 seconds. The Telegraf agent is writing the data to an InfluxDB time series database, which is queried and visualised using Grafana. This is all running on a Raspberry Pi 4B.
Fronius also offer system monitoring out of the box. When connected to the internet, data is regularly sent up to their Solar.web service, which can be accessed using their web interface and mobile apps. Solar.web has a free version which allows viewing basic data about the PV system (generation, consumption, export, etc.). Solar.web also offer an optional premium version that has more features such as ROI, PV production forecast, extended reports, and more.
Stay tuned for more! I plan on detailing more of the monitoring side of things over the next little while.
This blog will be updated with links to future parts as they are published 😄
In this series
- Solar monitoring part 1 - you are here
- Solar monitoring part 2